Base Functions
EcoPy contains several basic functions:
-
wt_mean(x, wt=None)¶ Calculates as weighted mean. Returns a float.

Parameters
- x: numpy.ndarray or list
- A vector of input observations
- wt: numpy.ndarray or list
- A vector of weights. If this vector does not sum to 1, this will be transformed internally by dividing each weight by the sum of weights
Example
Weighted mean:
import ecopy as ep
print(ep.wt_mean([1,3,5], [1,2,1]))
-
wt_var(x, wt=None, bias=0)¶ Calculates as weighted variance. Returns a float.
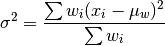
where
 is the weighted mean.
Parameters
- x: numpy.ndarray or list
- A vector of input observations
- wt: numpy.ndarray or list
- A vector of weights. If this vector does not sum to 1, this will be transformed internally by dividing each weight by the sum of weights
- bias: [0 | 1]
- Whether or not to calculate unbiased (0) or biased (1) variance. Biased variance is given by the equation above. Unbiased variance is the biased variance multiplied by
 .
.
Example
Weighted variance:
import ecopy as ep
print(ep.wt_var([1,3,5], [1,2,1]))
-
wt_scale(x, wt=None, bias=0)¶ Returns a vector of scaled, weighted observations.

where
is the weighted mean and  is weighted standard deviation (the square root of weighted variance).
Parameters
- x: numpy.ndarray or list
- A vector of input observations
- wt: numpy.ndarray or list
- A vector of weights. If this vector does not sum to 1, this will be transformed internally by dividing each weight by the sum of weights
- bias: [0 | 1]
- Whether or not the weighted standard deviation should be calculated from the biased or unbiased variance, as above
Example
Weighted variance:
import ecopy as ep
print(ep.wt_scale([1,3,5], [1,2,1]))
-
impute(Y, method='mice', m=5, delta=0.0001, niter=100)¶ Performs univariate missing data imputation using one of several methods described below. NOTE: This method will not work with categorical or binary data (see TO-DO list). See van Buuren et al. (2006) and/or van Buuren (2012) for descriptions of univariate, monotone, and MICE algorithms.
Parameters
- Y: numpy.ndarray or pandas.DataFrame
- Data matrix containing missing values. Missing values need not be only in one column and can be in all columns
- method: [‘mean’ | ‘median’ | ‘multi_norm’ | ‘univariate’ | ‘monotone’ | ‘mice’]
Imputation method to be used. One of the following:
mean: Replaces missing values with the mean of their respective columns. Returns a single numpy.ndarray.
median: Replaces missing values with the median of their respective columns. Returns a single numpy.ndarray.
multi_norm: Approximates the multivariate normal distribution using the fully observed data. Replaces missing values with random draws from this distribution. Returns m numpy.ndarrays.
univariate: Conducts univariate imputation based on posterior draws of Bayesian regression parameters.
monotone: Monotone imputation for longitudinally structured data.
mice: Implements the MICE algorithm for data imputation. Assumes the univariate model is the correct model for all columns.
- m: integer
- Number of imputed matrices to return
- delta: float [0.0001 - 0.1]
- Ridge regression parameter to prevent non-invertible matrices.
- niter: integer
- Number of iterations implemented in the MICE algorithm
Example
First, load in the urchin data:
import ecopy as ep
import numpy as np
import pandas as pd
data = ep.load_data('urchins')
Randomly replace mass and respiration values with NAs:
massNA = np.random.randint(0, 24, 5)
respNA = np.random.randint(0, 24, 7)
data.loc[massNA, 'UrchinMass'] = np.nan
data.loc[respNA, 'Respiration'] = np.nan
Impute using the MICE algorithm, then convert the returned arrays to dataframes:
imputedData = ep.impute(data, 'mice')
imputedFrame = [pd.DataFrame(x, columns=data.columns) for x in imputedData]
Alternatively, replace the missing values with the column means:
meanImpute = ep.impute(data, 'mean')
-
spatial_median(X)¶ Calculates the spatial median of a multivariate dataset. The spatial median is defined as the multivariate point
 that minimizes:
where
 is the euclidean distance between the vector
  and . Minimization is achieved by minimization optimization using scipy.optimize.minimize and the ‘BFGS’ algorithm.
Parameters
- X: numpy.ndarray or pandas.DataFrame
- A matrix of input observations
Example
Calculate the spatial median for a random matrix:
import ecopy as ep
from scipy.stats import multivariate_normal

np.random.seed(654321)
cov = np.diag([3.,5.,2.])
data = multivariate_normal.rvs([0,0,0], cov, (100,))
spatialMed = ep.spatial_median(data)